

Never Miss a Beat: Get a snapshot of the issues affecting the IT industry straight to your inbox.
All Twitter users can access a detailed report on their followers and individual tweets, including impressions, clicks, and engagement. Here's what you need to know.
4 Min Read

10 Big Data Online Courses
10 Big Data Online Courses (Click image for larger view and slideshow.)
Twitter just made it easier for you to gauge how well your tweets resonate with your followers.
Ian Chan, front-end engineer at Twitter, announced yesterday in a tweet that all users now have access to its analytics platform, which launched in July but was open only to advertisers and verified accounts. The analytics provide details on your tweets' engagement, clicks, retweets, favorites, replies, and more.
To access the analytics dashboard, log into analytics.twitter.com with your username and password. Analytics are provided to users who have had a Twitter account for at least 14 days, the company said.
[Popular social apps may track your every move. Read Location Tracking: 6 Social App Settings To Check.]
The main view of the dashboard displays a chart of the last 28 days, the number of impressions your tweets have received, and contextual information such as whether your impressions were higher or lower than the previous 28-day period. Impressions refer to the number of times a user sees your tweet in their timeline or in search results. Hover over any of the bars in the chart for a day-by-day breakdown of impressions.
Below the bar chart is your stream of tweets, which you can also sort by "Tweets and replies" or Promoted tweets, if you have ever purchased Twitter Ads. Twitter displays metrics next to each tweet, including the number of impressions; engagements, which refer to the number of times a user clicked, retweeted, replied, followed, or favorited it; and the engagement rate, a percentage that divides the number of engagements by impressions. You can't sort these individual columns by highest or lowest, however.
Clicking a tweet will let you drill down even further. This will show you the content of the tweet, plus a chart that displays the tweet's impressions over the first 24 hours.

Hover over any of the bars within the chart to see an hour-by-hour breakdown of impressions. Below the chart is a breakdown of the tweet's key metrics, including impressions, link clicks, embedded media clicks, retweets, favorites, and replies.
The right-hand column of the analytics dashboard shows you a breakdown of your engagement rate, link clicks, retweets, favorites, and replies over the last 28 days. Like the other charts, you can hover over any of the points for more detail.
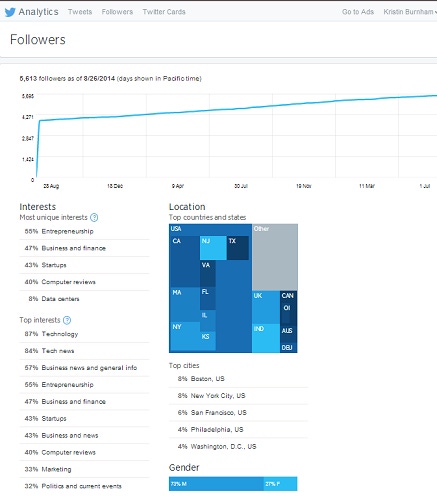
In addition to your individual tweets, the analytics dashboard also tracks your follower growth. Switch from the Tweets view to the Followers view at the very top of the page to access this.

Your follower analytics shows your growth over a one-year period. Hover over the line graph to view your count on a particular day. Below the chart you'll see a demographics breakdown of your followers, including the five most unique interests your followers share; your followers' top 10 interests; the top countries, states, and cities they come from; the gender breakdown; and the top Twitter accounts that your followers follow. Hover over any of these data points for more information.
Twitter's analytics dashboard will probably appeal mostly to power users looking to reach more people and improve engagement. The social network does place restrictions on who can access it, however. In addition to the 14-day account requirement, users must primarily tweet in English, French, Japanese, or Spanish, the company said. Your account must also be public.
In its ninth year, Interop New York (Sept. 29 to Oct. 3) is the premier event for the Northeast IT market. Strongly represented vertical industries include financial services, government, and education. Join more than 5,000 attendees to learn about IT leadership, cloud, collaboration, infrastructure, mobility, risk management and security, and SDN, as well as explore 125 exhibitors' offerings. Register with Discount Code MPIWK to save $200 off Total Access & Conference Passes.
About the Author(s)
You May Also Like
More Insights
Webinars
Editor's Choice


May 2, 2024
While there are plentiful options in cyber resiliency and business continuity tools and platforms, there isn’t one that can knock out everything from sudden cloud outages to prolonged ransomware attacks in a single punch. What can you do to keep the company on its feet no matter what is thrown at it? Find out in this new virtual event.
Reserve Your Seat Now