

Never Miss a Beat: Get a snapshot of the issues affecting the IT industry straight to your inbox.
More Than Pie Charts
Business intelligence is too important to be limited by outdated presentation and visualization.
8 Min Read

With practically 30 years in IT, I can remember when we (the conceptual IT) viewed technology as an enabler for some tasks but a constraint for many others. Those were the days when you could tell users, "Well, I'd like to help but there simply isn't any way to address that problem given the technology available." Technology choices were simpler then — mostly because they were few. Today, of course, it's a different story.
A dizzying array of great technology exists today that addresses most business intelligence (BI)-centric issues. But then why is it that much of what is being implemented is uninspiring BI technology that leads to mediocre solutions? Case in point, the ever-present pie chart.
Can you effectively interrogate a large OLAP cube using a simple pie chart? Can you really report and communicate all the necessary insight through your dashboard, given the volume and complexity of data, with just a pie chart? The obvious answer is no. But any of the advanced tools necessary to address complex BI issues seem slow in adoption, including visualization (Gartner, Dec. 5, 2003). Even though more robust visualization tools and technologies are available, the pie chart continues to be thrown in front of users.
The currently available technology is far outpacing our ability to comprehend its application and effectively absorb it into our BI environments. Architects, designers, and project planners simply have no idea what solutions exist or how to implement them. Some BI architects espouse the idea of standards in what almost seems a defensive maneuver. Too often the excuse is, "Well, the standard OLAP tool we use is x" — regardless of whether x can address the task at hand. The value of standardization is well understood; however, should it be invoked to the detriment of delivering actionable insight? Certainly not.
A Taste Of Advanced BI
Within virtually every segment under the BI umbrella, examples of leading technology can have a dramatic impact on the ability for user communities to make better decisions. From OLAP to dashboards, from event-based data capture to data quality, the number of tools far exceed those traditional few vendors whose advertising budgets are the biggest.
Spatial Enabled Dashboard. Map Intelligence affords interactive analysis between components of traditional BI technology, such as charts (pie charts) and pivot tables, with spatial technology for creating maps. Each component is synchronized such that any data manipulation, limits, filtering, or chart slicing is automatically reflected in the maps as shown in Figure 1. It's this blend of traditional and nontraditional BI technology that provides a unique dashboard environment.
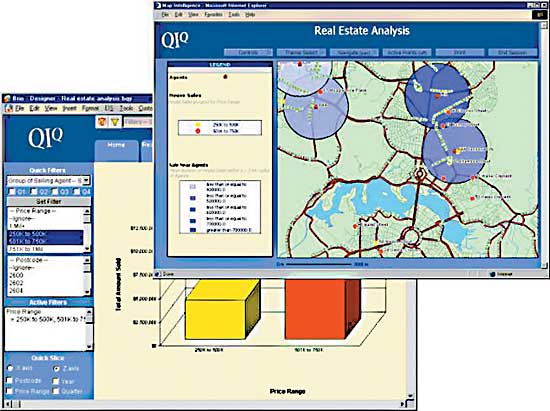
FIGURE 1 Spatial enabled dashboard.
Map Intelligence lets user dynamically generate and query maps from any tabular source, not only making the user experience more meaningful, but also enhancing the visualization impact of the data being examined. Spatial layers are dynamically generated from the facts and dimensions reflected in the pivot tables and charts. The experience is a seamless integration between spatial analysis and a familiar BI dashboard.
The core technology of Map Intelligence, aside from the dashboard, is the middleware component between the dashboard itself and a geographic information system (GIS). All spatial capabilities are derived and served up from the spatial technology that's being accessed — for example, ArcIMS from ESRI, which is an Internet map server. Future releases of Map Intelligence are planned to interface with ArcGIS, also from ESRI, to take advantage of advanced spatial analytic and presentation capabilities.
With Map Intelligence, dashboard users aren't constrained to only the traditional time analysis anchor. Instead, analysts now use space as a second anchor point. Both time and space analysis combine to provide unparalleled opportunity to transform typical data into informational insight.
Exploratory OLAP. Another example of high-end analytics, supported by advanced visualization tools is a Poly Surface chart generated by a product called PolyVista (see Figure 2). The image depicts the graphical relationship (surface plot) of the measure Profit in terms of two dimensions, customer Education Level and Yearly Income.
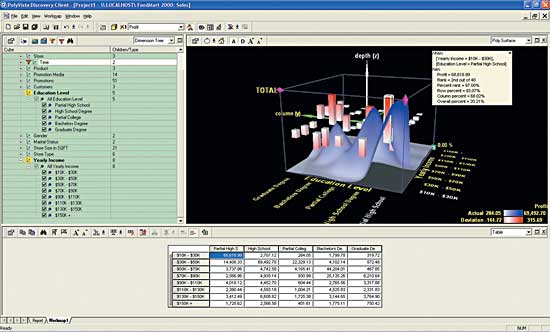
FIGURE 2 Advanced visualization.
The blue surface maps the actual profit value for each cell in the table with larger values seen as darker blue peaks and the smaller values shaded a lighter blue. The figure helps visualize the profit potential across customers from low education to high education as well as from low salary to high salary.
Superimposed on the profit profile are bar markers indicating cell intersections where the profit is either greater than or less than expected. This statistical deviation is greater than expected where the bars rise above the midplane and lower than expected profits where the bars project downward from the midplane. These high and low deviation scores highlight points of interest to the sales analyst.
PolyVista is all about providing advanced OLAP tools and techniques, enabling analysts to aggressively interrogate dimensional data. Fundamental to all aspects of this technology is the notion of exploratory data mining and advanced visualization to support the traditional drill-down, roll-up, and slicing and dicing indigenous to OLAP solutions. The combined solution provides analysts some of the best opportunities to information insight.
Let's see, volumes of complex data, what do I use? Pie chart or Poly Surface? Hmm.
Who Drives Adoption?
When considering the introduction of new technology to address BI requirements, only the following four possible parties are involved:
Users. The users certainly have a vested interest in building a great BI solution to address their needs. They seem to want, if at all possible, the means to quickly assess their subject areas, identify insights, and immediately act on those insights.
IT. Your IT group is equally compelled to provide an effective BI environment. (For the purposes of this column, IT is synonymous with BI architects, solution strategists, project planners, designers, and anyone else from IT involved in selecting technology for the BI environment.) Of course, IT is also responsible for supporting the BI beast; and, therefore, is heavily influenced by concepts such as standardization. The notion of implementing new or non-standard technology often must be proven to be necessary for most IT shops.
Vendors. No one can argue that vendors have an interest in getting their technologies adopted into the BI environment. Vendors, however, do come with what is seen as a less-than-stellar reputation — all too often deserved. They will do and say things, right or wrong, misleading, misguided, or simply misinformed, to get the sale.
Executives. The executives of any company have much bigger issues to consider than which visualization technology is better for addressing user communities' requirements. Nevertheless, all too often executives are dragged into the debate.
With these four parties in mind, I see the following scenario played out over and over again.
IT has standardized on product(s) x. The users are convinced that product x won't do what they need. They've arrived at this conclusion through their own research and experience, or by being influenced by a vendor of a competing product. In either case, the users approach IT with their concerns. IT considers the issues but invariably wants to attempt to address the user requirements with product x, even if it's more cumbersome or not quite what the users want. Users then go to a vendor that sells product y, which does what they want. The vendor teams up with the users to prove the need for implementing product y.
Together, the users and vendors begin a relentless lobbying effort to convince IT that product y is the only way to go. If IT remains unconvinced, the issue is raised to the executive level. At this point, we may forgo logic because only politics will settle this issue now.
Sound familiar? Of course it does. We've all seen some variation of this scenario played out in our own organizations or projects. And it isn't flattering for IT, users, or vendors. The simple truth is that instead of having a proactive stance and procedure for adopting new technology, we've created an informal bureaucracy of red tape.
Leading The Way
Technology doesn't have to be the bottleneck to resolving business needs. From my perspective, we have great technology that can address a wide range of business requirements. So I have to ask the question, why is it that IT and user community adoption rates lag so far behind the available technology?
The visualization technology shown in this column provides gorgeous, elegant solutions that feed our human need for visualization. And yet, we struggle against the disturbing trend of lagging adoption — often at the hands of those whose responsibility it is to ensure the best-of-class technology is available for their user communities: IT.
One remedy to avoid the scenario I've described is to retain architects and designers with considerable depth and appreciation for the BI space. It is, after all, the architects and designers who must create a BI environment that delivers on the promise of BI: Actionable insight. Who better than these individuals to direct the adoption of leading, best-of-class, technology to support that environment? But if IT won't lead, then users and/or vendors will push.
But regardless of who leads, one thing is certain: If all you're providing your users is a pretty pie chart, you're not doing enough.
Michael L. Gonzales is the president of The Focus Group Ltd., a consulting firm specializing in data warehousing. He has written several books, including IBM Data Warehousing (Wiley, 2003). He speaks frequently at industry user conferences and conducts data warehouse courses internationally.<
Email the editors at [email protected]
Resources
|
About the Author(s)
You May Also Like
More Insights
Webinars
Editor's Choice


May 2, 2024
While there are plentiful options in cyber resiliency and business continuity tools and platforms, there isn’t one that can knock out everything from sudden cloud outages to prolonged ransomware attacks in a single punch. What can you do to keep the company on its feet no matter what is thrown at it? Find out in this new virtual event.
Reserve Your Seat Now