

Never Miss a Beat: Get a snapshot of the issues affecting the IT industry straight to your inbox.
Vendor demos often obscure architectural differences between BI suites. Yet, as our BI Scorecard series concludes, you dare not overlook them.
11 Min Read

In the last six installments of this series, I've looked in depth at a number of functional areas by which to evaluate BI suites. In this final column, I address architectural considerations and wrap up with a context to help you determine the best BI tool for your company.
Continuing the car-buying analogy I've used throughout this series, discussions about BI architecture are similar for many people to hearing car dealers tout overhead cam versus inline-6. Customers want to shout, "Skip the techno babble, just tell me the benefits!" Is it fast, does it scale, and most important, does it work within my current infrastructure?
There are many aspects of a BI architecture that will never come across in a vendor demo, such as:
Whether it's client/server or Web-based
The OLAP approach used (MOLAP, ROLAP, or DOLAP)
How easily the BI tools can be customized or embedded within other applications
How common is the framework (metadata, security, and infrastructure) that the suite uses across the different tools, such as query, reporting, OLAP, dashboards, or analytic applications?
Whether services can be distributed across multiple servers and platforms.
Just as you may have to open the hood of a car or take it for a test drive to see some of the engine differences, so too will architectural differences in the BI suites become apparent only when you install, deploy, or customize the products.
Service-Oriented Architecture
As BI has moved to the Web and to enterprisewide deployments, many BI tools today have a serviceoriented architecture (SOA). An SOA allows different BI services to perform specialized tasks and, when necessary, to be distributed across multiple servers. As an example, let's look at three possible BI services: query, presentation, and scheduling. (See Figure 1.) Keep in mind that each BI tool may have more (or fewer) specialized services that may handle tasks such as logins, prompt generation, request routing, and so on. (For more on prompt generation, see Part 1: Query, in Resources.)
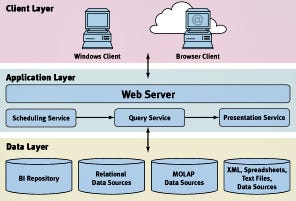
FIGURE 1 Service-oriented architecture for BI tools: BI application servers can run on either a Web server or a dedicated application server.
In Figure 1, the query engine is responsible for querying the data source, possibly a data warehouse or MOLAP cube. After the query completes, the presentation component must convert the query results into meaningful reports, perhaps with charts and crosstabs, and potentially in different file formats such as HTML or PDF. If a user schedules a query (see Part 3: Information Delivery), the scheduling service continuously monitors when it's time for the scheduled request to become active and passes it over to the query service. How the query, presentation, and scheduling components communicate is where standards such as COM, CORBA, and Web services protocols come into play. Alternatively, a BI vendor may use proprietary approaches to handle these communications. COM and CORBA are older methods of supporting an SOA; Web services standards are gaining both acceptance and capabilities. (See "Web Services: It's About Connections," Intelligent Enterprise, Oct. 10, 2003.)
A Scalable Architecture
In the Information Delivery segment, I discussed how your deployment approach affects scalability. So does the architecture. Anecdotally, all the BI tools seem to scale both up and out: If you add more powerful hardware (scale up), it supports more users. If you add more servers (scale out) and distribute services across them, it also supports more users. However, the goal for many companies is to reduce complexity and costs. Setting aside considerations for fault tolerance, if everything runs efficiently on one server, you save hardware and administrative costs.
Unfortunately, no benchmarks exist that will tell you how each product compares with others running on identical platforms. Furthermore, the way you use and deploy the products, even within a suite, affects scalability. For example, refreshing Business Objects full client documents is much more resource intensive than refreshing its newer thin-client documents. With MicroStrategy, the fewer aggregate tables in the data warehouse and the fewer filters used within a report template, the slower the system. Thus, your best bet for evaluating scalability is a proof of concept that replicates how your company intends to use a given BI suite.
There are, however, some features you can look for that will give insight into how resource intensive a given product suite is: OLAP architectures (see Part 5: OLAP), multithreaded processes, query governors, and caching. Query governors allow administrators to prevent complex and bad queries from saturating the system. Table 1 gives two scenarios for different types of queries. The first scenario, in which there are many small and quick queries, shows a server that needs only three concurrent query processes and 300MB RAM. The second scenario takes the same number of queries but ones that return larger results and are more complex to run. This second scenario, in the absence of a query governor, would require 60 concurrent query processes and 6GB RAM! These numbers don't even consider the impact on CPU utilization. The best BI tools provide query governors that let you control the number of concurrent query processes, number of rows returned per query, and time for a query to run. Ideally, these restrictions should be customizable at various levels such as per server, groups of users, role, or individual user.
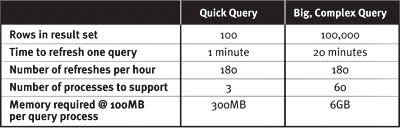
TABLE 1 Two scenarios comparing resources for different query types.
Another way to minimize the risk of this kind of server load is caching. If a request for a query refresh can be served via cache, then you need fewer concurrent query processes. Caches also help other services in a BI architecture, such as authorization (see Part 6: Administration) and presentation services. Among the BI suites reviewed here, there is an enormous range of what gets cached and where — either in memory, to disk, or via temporary database tables. The importance of caching is very much dependent upon any given tool's architecture.
MicroStrategy has extensive caching including SQL, metadata, and even query results. Administrators have good control in both specifying what gets cached and monitoring if the caches are used. Informatica PowerAnalyzer also allows report caches to be updated on a scheduled basis. BusinessObjects caches authorization and security information. However, if multiple users build similar queries, the requests are not served from cache. BusinessObjects plans to introduce report caching in version 6.5 due imminently. Cognos ReportNet currently has quite limited caching and plans on improvements in its next maintenance release due this fall.
Platforms and Databases Supported
As Table 2 shows, all the BI products reviewed here will run on a Windows platform, but not all run on Unix, and even fewer support Linux. Hyperion and Informatica are the first of this bunch to support the Linux platform. However, Hyperion Administration Services, which is used to design and administer Hyperion Essbase applications, requires Windows. As with all the scorecards in this series, interpret these scores carefully: The yellow score for the Microsoft and MicroStrategy platforms is relevant only if you want to deploy on Unix or Linux.
BI vendors support access to many databases through ODBC. However, to leverage SQL extensions for specific databases often requires native support for a given database. Crystal Enterprise and Information Builders' Web Focus provide extensive support to legacy databases through native database drivers. Although MicroStrategy uses ODBC, it leverages specific drivers so that the SQL generated is optimal for the given database.
While the BI tool may have broad support for various RDBMSs as data sources, that same support doesn't always exist for the BI repository. The BI repository typically stores information such as security definitions, data source connections, business views, and reports or paths to file-based reports. Microsoft Reporting Services is limited to SQL Server for its repository. Hyperion uses MySQL. In the past, Cognos has been criticized for not having an open architecture, as Cognos Impromptu Web Reports (IWR) uses a licensed object store. With the new ReportNet, the repository uses a relational database. ReportNet supports the three leading database vendors (SQL Server, Oracle, and DB2) but does not support Sybase and Teradata for the BI repository.
Strategic Considerations
My goal in writing this series was to help provide insight into what BI features are important and why. A feature-by-feature comparison is one way to select and standardize on a BI suite, but it isn't the only one. When buying a car, perhaps you buy a Ford because you want to "buy American," perhaps GM because your neighbor is a dealer, or perhaps Hummer because you like the image.
Similar intangibles and strategic considerations also apply to BI suites, none of which translates well into a scorecard — and any such scores will be extremely subjective. Each BI vendor has a unique BI strategy. For example, arch competitors Business Objects, Cognos, and Hyperion all pursue business performance management (BPM) but in drastically different ways and with BI playing a slightly different role in each. MicroStrategy, on the other hand, continues to view BI as an enabling technology for any kind of information asset, whether used for strategic initiatives such as BPM or for operations. Informatica has a somewhat similar view but with ETL or "universal data services" being more central. Microsoft, meanwhile, makes no claims about BPM but clearly wants to corner the BI infrastructure market. Whose vision is "best" can be determined only with time — it will depend not just on vision but successful execution.
Each vendor has its own unique "sweet spot," historical origins, and view of how broad a box BI is. Some have expanded the scope to include databases, ETL tools, and analytic applications. Others vendors continue to stick to core query, reporting, and OLAP. Is either approach better or worse than the other? The answer depends completely on your point of view. If you already have an ETL tool, do you really care if your BI vendor offers a different one? Indeed, there are interoperability considerations such as metadata exchange and security (see Part 6: Administration), but at this stage in the BI market, interoperability issues challenge both the companies that standardize on the full spectrum of BI tools from one vendor and those that buy tools from multiple vendors.
With the increasing scale and critical influence BI can have on an organization, I consider support and account management to be of key importance. Functions and features don't matter a bit if the tool doesn't perform in your environment. When something fails, you want someone to be accountable and to provide a solution. Anecdotally, some vendors seem to fare better with this in part because of their business models, and in part because of lower employee turnover. Unfortunately, there's no objective guide that rates the vendors on support. (A Zagat Guide for BI would be good, wouldn't it?) As you evaluate the tools, assess if you can work with the BI vendor over the long term.
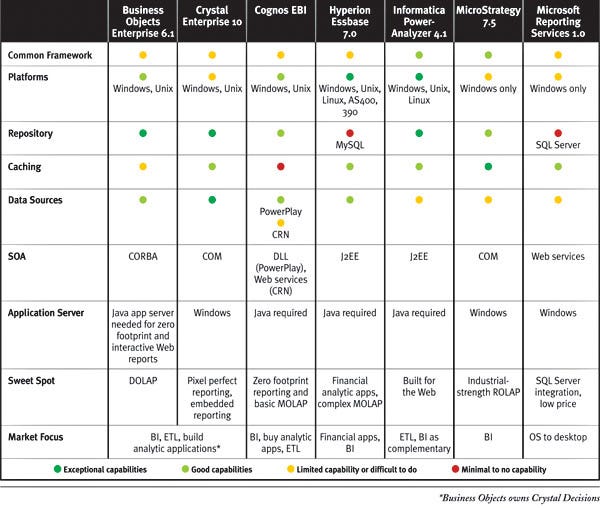
TABLE 2 Scorecard comparing architectures and market strategies of several BI suites.
The Best BI Tool
If you analyze each of the scorecards in theses seven reviews, you'll notice that no one vendor is particularly superior in all functional areas. Study those green scores well and leverage them in your own deployment. Conversely, be aware of the red scores and plan your implementation accordingly. In this respect, there isn't a single best BI tool in the market, but rather, a best fit for your company and particular deployment goals. Other products not included in this series may have best-of-breed functionality in particular functional areas. As I'm able to give you a similar apples-to-apples comparison for additional products, watch for future articles and details on www.biscorecard.com. Ultimately, the best BI tool isn't determined by market share or by who has appeared in this series. Instead, it's the one that most effectively enables users to fulfill their business goals!
Cindi Howson is the president of ASK, a BI consultancy. She teaches TDWI's "Evaluating BI Toolsets," publishes BI reviews at biscorecard.com, and is the author of Business Objects: The Complete Reference (McGraw-Hill Osborne Media, 2003).
Resources |
Earlier installments online at IntelligentEnterprise.com:
|
About the Author(s)
You May Also Like
More Insights
Webinars
Editor's Choice


May 2, 2024
While there are plentiful options in cyber resiliency and business continuity tools and platforms, there isn’t one that can knock out everything from sudden cloud outages to prolonged ransomware attacks in a single punch. What can you do to keep the company on its feet no matter what is thrown at it? Find out in this new virtual event.
Reserve Your Seat Now