

Never Miss a Beat: Get a snapshot of the issues affecting the IT industry straight to your inbox.
Choosing the right data visualization for your information is the key to letting your data tell a story.
3 Min Read
For a period of time, starting about 18 months ago,
I don't hold malice against any data visualization technique. They all have their time and place. What I find distressing is how some are not understood well and then used poorly to represent ideas. In the Introduction to SAS Visual Analytics book, my goal was to discuss good data visualization basics while showing how to use the many techniques. I specifically wanted to help someone new to data visualization understand how to get the best results. Inexperienced users seem to most struggle with what I call the single-use techniques. When these techniques are used properly, it is like uttering a simple sentence. When they aren't, it's just like blabbering on incoherently. This confuses the viewer and shows how green the creator is.
Overused and Abused
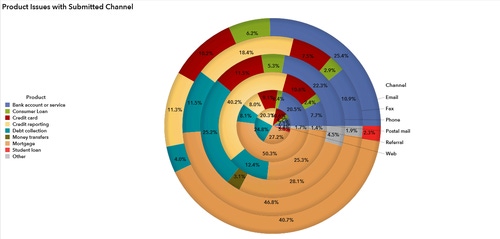
When you think of misused data visualization techniques, the pie chart may come to your mind first. In a recent lecture, a DataViz expert noted the pie chart was so offensive, it could only be shown on the screen for a few moments. What many experts miss is that a pie charts must be used correctly to be effective. As a result, there are few cases when they are appropriate. Plus, it is so easy to find bad examples that it is almost comical.
Here's an example from my book that breaks all the rules. I didn't even explain how to recreate it because I don't want anyone to know!
An effective pie chart works best when there are few categories and one category is dominant. The example I give in the book is based on a survey question. But notice that your eye can immediately get an answer to the question -- maybe before you even had time to say it in your mind.

Just Measure One Thing
Anything that people say about pie charts, they lovingly apply to dashboard gauges as well. Dashboard gauges work best when you show how close you are to a target at a particular moment. The idea is that your organization doesn't have eleven-ty million targets but a few simple ones. However this is a visually delicious object! Plus, the data seems more important when displayed with a dial thus the creator must be super intelligent!
If you don't understand that these gauges measure performance, then you tend to use them as fancy pie charts. Often, I see users want to use as many gauges as possible at once! It looks like the picture below where airline food quality is measured. There are too many gauges for the user to understand what is important. Consider when the same information is converted to a table (on the right). It is much easier for the viewer to understand who is succeeding and it uses less space!

More Month Than Money?
As I was writing the book, I was trying to find practical but unique use cases for the examples. The more difficult the object was to learn, the simpler the use case should be. The waterfall chart soon turned into my enemy. A waterfall chart shows exactly how an amount changed over a period.
I really couldn't find a good example that did not involve money. Most people understand starting with a pile of cold hard cash and then seeing it chipped away during the monthly bill pay cycle. I'm sure it can be used to show how other things transform (like inventory) but money is the most likely candidate.

When you are just getting started, it's so easy to make mistakes because you don't understand when to use a one technique over another.
About the Author(s)
You May Also Like
More Insights
Editor's Choice


May 2, 2024
While there are plentiful options in cyber resiliency and business continuity tools and platforms, there isn’t one that can knock out everything from sudden cloud outages to prolonged ransomware attacks in a single punch. What can you do to keep the company on its feet no matter what is thrown at it? Find out in this new virtual event.
Reserve Your Seat Now