

Never Miss a Beat: Get a snapshot of the issues affecting the IT industry straight to your inbox.
COVID-19: Using Data to Map Infections, Hospital Beds, and More
The spread of the novel coronavirus, COVID-19, and the resources to fight it, are being tracked and mapped by governments and other organizations in the US and the world. Here's how they are doing it.
6 Min Read
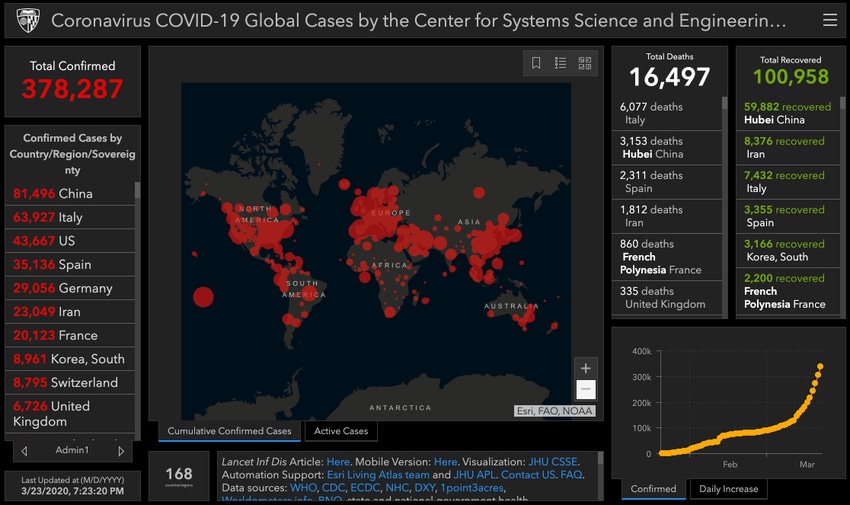
Image: with permission from Esri
IT organizations have recently had to turn on a dime to get their organizations’ workforces set up to work from home in the wake of the novel coronavirus COVID-19 pandemic. Wherever you are in that effort that to enable a remote work program for your enterprise, you’ve probably also asked yourself the question, how long will this go on? When will all this end?
But before we can even consider the question of when it will end, we need to figure out where we are now. For that we need data, visualizations and maps. Since the early days of the COVID-19 crisis in the US, the dashboard created by Johns Hopkins has been letting visitors to the site track the growth of cases worldwide in near real time.
Esri, the company that provided the technology behind that dashboard and map has reached out to organizations working on different aspects of fighting the pandemic to let them know that they can also use the software for free for 6 months. It’s an offer that Esri has made in previous disasters including the Northridge earthquake, the Fukushima Daiichi nuclear disaster, the Nepal earthquake, the California wildfires, and many others, Este Geraghty told InformationWeek. Geraghty is Esri’s chief medical officer and health solutions director.
In this crisis, Geraghty and her colleagues have created a compilation of resources including data, maps, applications, and examples of what others have created into a hub site that shows all the data and mapping work being done in an effort to help researchers and first responders have access to the information they need to fight the pandemic.
{Image 2}
“We compiled all those different examples we saw into a hub site and made it available so that people can take a look and download data and start to make their own stuff," Geraghty said.
Esri is not unique in offering free software and technology services to help companies respond to the challenges posed by COVID-19 and new ways of operating. For instance, Microsoft is making the premium version of its Teams collaboration software available for free for 6 months as part of a trial offer. Zoom is offering its videoconferencing app for free to K-12 schools in the US. Facebook announced that its Workplace app will be free to government agencies and emergency services for 12 months. There are plenty of other offers of free SaaS services, too.
But Esri's contribution is targeted at those tracking and fighting the pandemic, and communicating about the pandemic.
Geraghty's group created a collection of templates and assembled them into an integrated solution that is now being used by a multitude of governments in the US and around the world for different purposes to help battle the pandemic. These can be accessed via the hub site. For instance, the state of Alabama has created a map of their COVID-19 testing sites. Arizona has created a map of school closures. Missouri has created a few maps. Already, a total of 50 hub sites have been stood up in the first week, as of March 23, Geraghty said. In addition, there are 188 different dashboards or applications that have been created around the world to combat COVID-19 using the Esri program. What's more, since announcing the program for COVID-19, Esri has received over 4,000 requests for assistance from around the world.
A big problem that looms on the horizon for hospitals and healthcare providers is whether they will have enough supplies and equipment for the coming surge of seriously ill patients. Are there enough protective masks? Are there enough beds? Are there enough respirators? Esri has partnered with a company called Definitive Healthcare, which tracks the number of hospital beds in the US, facility by facility, to make that data easy to access and visualize.

Este Geraghty, Esri
Mapping capacity is one of five steps that Esri is recommends to those working to track and fight the pandemic. The following list includes all five:
Map the cases. But more than just mapping the cases, you need to also know who has recovered, who has died, and who is an active case.
Map the spread of the virus. Geraghty, who is both an internist physician and a spatial epidemiologist, said the traditional way to do this is to count how many new cases there are per day. Esri, however, is recommending taking a geospatial approach with an animated map that lights up as you see the spread. Researchers may also want to track the movement of people, perhaps through cell phone data, or focus on places were people tend to come into contact like shopping malls.
Map vulnerable populations and places. For instance, census information could provide you with information about where older adults live. You could look at retirement homes or assisted living. You also may want to look at homeless encampments, prisons, and immigration detention centers. You want to ask yourself the question, where do you need to protect people at higher risk.
Map your capacity. This is the hospital beds and your supplies, but it could also be the points of dispensing. Are they near or far from the highest needs. With this type of mapping, you start to be in a position to shift resources, Geraghty said.
Finally, you should communicate with maps. How do you take all this and share the appropriate information with the public to make sure they are informed.
States can use information like this to help decide, for instance, where is the best place to locate a testing center. The geography is important if you want to meet the highest population need.
Geraghty urged data scientists creating models to remember that this is a novel virus, so it's very different to create a mathematical model of how it spreads.
"You use proxy variables and estimations to get at good decision making," she said. "We know we are learning as we go. People should put into place models that can be tuned or adjusted as we learn."
For more on IT's COVID-19 response, read these:
Coronavirus: 8 Tech Tips for Working From Home
Coronavirus Plan: How IT Can Enable Remote Work
Pitfalls to Avoid in the COVID-19 Rush to Work from Home
C-Suite Taps IT Leaders Amid Coronavirus Crisis
The Role of AI in the Race for a Coronavirus Vaccine
Developing a Continuity Plan for the Post-Coronavirus World
About the Author(s)
You May Also Like
More Insights
Webinars
Editor's Choice


May 2, 2024
While there are plentiful options in cyber resiliency and business continuity tools and platforms, there isn’t one that can knock out everything from sudden cloud outages to prolonged ransomware attacks in a single punch. What can you do to keep the company on its feet no matter what is thrown at it? Find out in this new virtual event.
Reserve Your Seat Now