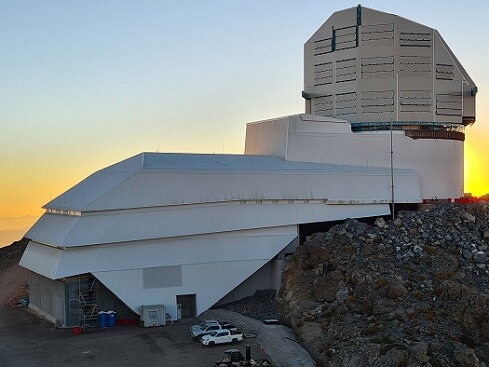
Optical observatory under construction using InfluxData to help it process data to be collected over time from the stars.

Faced with a long-term project to gather and process vast amounts of visual data from the universe, the Vera C. Rubin Observatory in the mountains of Chile turned to an open source, time series database, InfluxDB, developed by InfluxData.
The observatory and its 8.4-meter optical telescope are being built to survey the region of space viewable from the southern hemisphere for 10 years, capture about 1,000 images of the sky on a nightly basis. The project, called the Legacy Survey of Space and Time, is expected to generate 500 petabytes of visual data astronomers should be able to use to better understand the cosmos.
The Rubin Observatory, funded by the National Science Foundation and the Department of Energy, will aim to gather data on some 37 billion stars and galaxies, and gain further insight on stellar phenomena such as dark matter, dark energy, and asteroid movement.
Operating complex astronomical telescopes requires a sound understanding of the instrumentation, says Frossie Economou, project manager for the Rubin Observatory Science Platform. Though the observatory is in Chile, scientists around the world have interest in the data, she says.
As the project progressed, Economou says the team realized they needed to focus on that intricate work rather than be tied up dealing with storing and processing a flood of instrument readings. When the 3-gigapixel camera, telescope, and other equipment are fully assembled, the observatory is expected to generate substantial data at a high frequency, she says. “The telemetry is high volume. Even without the telescope in full construction we are already collecting about a terabyte of telemetry a day.”
The team currently uses the open source version of InfluxDB, says Angelo Fausti, software engineer with the observatory, though they are updating to another tier. “We are currently planning the migration to InfluxDB 2.0,” he says. That migration will include a new user interface with new visualization capabilities for different scatter plots, heat maps, and histograms, Fausti says. “It’s a tool made for developers and we, as scientists and engineers, are also developers.”
The observatory made a prior attempt to build a traditional MySQL, relational database, Economou says, to store and analyze telemetry, but it was challenge. The team was already using Apache Kafka and InfluxData for a different use case at the time, she says, and recognized those resources could be used to collect data at a high frequency, volume, and throughput. “We realized that our telemetry was a very good fit for this,” she says. The observatory team then built their engineering facilities database using InfluxData and Kafka, an open-source platform for handling data feeds, to that end.
InfluxData has also been useful for troubleshooting the facility, Economou says. “You’re trying to understand the origin of a problem or behavior in your hardware,” she says. “Otherwise you’re flying blind.” The observatory, situated in the Chilean Andes at an elevation of 9,000 feet, requires an on-premise installation of InfluxData, Economou says, because of the potential for instability in the connections to the mountain summit. “There’s a lot of fiber between us and the telescope.”
Economou says the team uses Kafka to work with the large amount of telemetry data captured that needs to be replicated to a data facility at the National Center for Supercomputing Applications in Illinois. From there, the data can be aggregated as well as used to create statistical representations of the data, she says.
The observatory expects to commence survey operations in 2024, Economou says, and plans to generate chronographs via visualization through InfluxData, so data scientists and engineers can examine and interact with the data. “You’ll be able to see changes on a scale that has never been achieved before in astronomy,” she says.
Related Content:
The AI Ecosystem: Mapping the Future of Data Science
What CIOs Need to Know About Graph Database Technology
Capella Space Goes with AWS to Handle Satellite Downlinks
About the Author(s)
You May Also Like


