

Never Miss a Beat: Get a snapshot of the issues affecting the IT industry straight to your inbox.
SAS Visual Analytics turns what-if analysis around, showing users what it will take to reach specific business goals.
3 Min Read
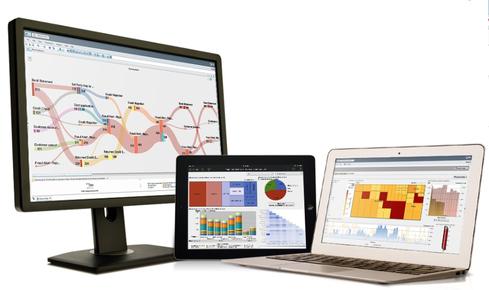
SAS Visual Analytics runs on desktops and tablets. New path-analysis capabilities are visualized through Sankey diagrams like the one at left.

8 Germ Hotspots In The Office
8 Germ Hotspots In The Office (Click image for larger view and slideshow.)
SAS brought together the strengths of in-memory analysis, data visualization, and forward-looking predictive analysis in SAS Visual Analytics, released in 2012. In an upgrade announced Wednesday, SAS has added goal-seeking and path-analysis capabilities that change the focus from predictive insights to desired business results.
Visual Analytics (VA) combines dashboarding and reporting capabilities, associated with conventional business intelligence (BI) software like IBM Cognos and SAP Business Objects, with today's sought-after data-exploration capabilities, offered by the likes of Tableau Software and Qlik. Add in SAS predictive analysis and it's a combination rarely found in a single product, much less one aimed squarely at business analysts rather than PhDs and data scientists. VA has proven to be appealing, with more than 2,600 licenses sold since the product's debut, according to SAS.
[Want more on SAS's option for serious wonks? Read SAS Brings Visual Modeling To Data Scientists.]
The big news in the VA 7.1 update announced this week is guided analytics. Goal seeking, for example, lets users define a business goal, such as unit sales or profitability, and then see how other variables, such as marketing spend or material costs or other factors, will have to change in order to meet that goal.
"Think of it as a forecast that's based on contributing values," said Robby Powell, SAS marketing manager for BI, in a phone interview with InformationWeek. "When you set a new goal, you immediately see the impact on the variables that support that forecast. If you want more revenue, for example, you may need to increase your sales force, improve quality, or spend more on advertising."
Goal seeking turns what-if analysis on its head, telling you what it's going to take to reach a goal, rather than changing variables to see how they impact outcomes. Of course you can still take the what-if approach if you want to explore different ways to achieve an end goal.
Path analysis, also known as customer-journey analysis, is another guided-analytic feature, but this one lets users study just how transactions move through a system. An e-commerce website is a perfect example of such a system, as it's natural for retailers to study how customers move -- e.g., where they enter, navigate, and leave the site. Paths are shown in Sankey diagrams, as shown in the image below. With path analysis, retail analysts using VA can predict (or set goals for) desired outcomes and see where website improvements and redesigns might be needed.
In another improvement in VA 7.1, simple text analysis has matured into robust sentiment analysis. Previously VA surfaced simple word-cloud visualizations showing terms associated with, say, products, services, or brands. Word clouds are still used to surface the terms that show up in social streams, CRM comment fields, or other text sources, but users can also drop down into stacked bar charts showing the volume of positive, neutral, and negative sentiments associated with each term and phrase.
VA 7.1 runs on a memory-intensive cluster of low-cost, industry-standard servers or on a standalone, high-scale Hadoop Distributed File System. Work is underway to enable VA on YARN, which will enable it to run on Hadoop clusters and data hubs built on Apache, Cloudera, Hortonworks, and Pivotal HD Hadoop distributions. Of course, data can be sourced from leading relational databases, and VA 7.1 specifically adds support for high-speed loading from SAP Hana.
VA 7.1 started shipping earlier this month, and it's also available through the SAS Cloud. SAS recently expanded its private-cloud hosting capabilities at its headquarters in Cary, N.C., and it has extended those capabilities globally through Amazon Web Services data centers in Ireland and Australia.
While there's a role for PhD-level data scientists, the real power is in making advanced analysis work for mainstream -- often Excel-wielding -- business users. Here's how. Get the Analytics For All issue of InformationWeek Tech Digest today. (Free registration required.)
About the Author(s)
You May Also Like
More Insights
Webinars
Editor's Choice


May 2, 2024
While there are plentiful options in cyber resiliency and business continuity tools and platforms, there isn’t one that can knock out everything from sudden cloud outages to prolonged ransomware attacks in a single punch. What can you do to keep the company on its feet no matter what is thrown at it? Find out in this new virtual event.
Reserve Your Seat Now