

Never Miss a Beat: Get a snapshot of the issues affecting the IT industry straight to your inbox.
SAP InfiniteInsight brings Hadoop and location data into predictive models. BusinessObjects ties data-integrity knot with SAP Lumira.
3 Min Read
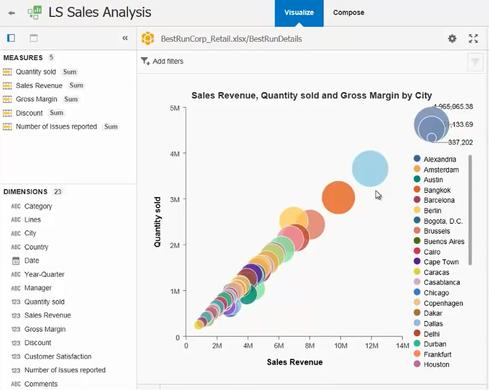
SAP Lumira, the vendor's data-discovery product seen above, is now integrated with the SAP BusinessObjects business intelligence suite.

10 Big Data Online Courses
10 Big Data Online Courses (Click image for larger view and slideshow.)
SAP made two important announcements on the data-analysis front on Thursday, introducing support for Hadoop and geospatial data through its InfiniteInsights advanced analytics product and unveiling long-sought-after ties between its Lumira data-discovery tools and BusinessObjects suite.
InfiniteInsight joined the SAP family through last year's acquisition of KXEN, and it was sought after for its ability to enable non-PhDs to build and tweak predictive models without the manual, iterative steps associated with conventional analytics software.
With the InfiniteInsights 7.0 release this week, the product gained support for big data sources including Hadoop Hive 11 and 12 as well as Pivotal's high-scale Greenplum 4.2 database. The release also adds support for KML, GML, and shapefile geospatial data formats. Hive is the Hadoop framework's SQL query engine, and with access to Hive tables, InfiniteInsights can add sensor data, log file data, clickstreams, and other data types typically stored in Hadoop into predictive models. And whether in Hadoop or other sources, geospatial latitude and longitude data can now be brought directly into InfiniteInsight predictive models.
[Want more on SAP InfinteInsight? Read SAP: Advanced Analytics Not Just For PhDs Anymore.]
Likely applications include predictive maintenance, churn, fraud, social network, and image-based analyses. SAP customer John Deere, for example, is building a predictive maintenance application for its farm and construction equipment, and Hadoop would be an obvious high-scale, low-cost choice for storing high-scale sensor and geospatial telematics data.
Fraud analyses done by banks and churn analyses done by telecom providers often include geospatial and social-network-influencer dimensions. Here, too, Hive and geospatial support will make predictive work easier.
"Customers previously had to handle geospatial dimensions outside of the [InfiniteInsights] predictive models," said SAP's Chandran Saravana, senior director of advanced analytics, in a phone interview with InformationWeek. "Now they can build everything into the model and it eliminates the need for external coding."
With this week's release of SAP Lumira 1.19 and SAP BusinessObjects 4.1, the big news is integration of the two products. BusinessObjects is the company's flagship business intelligence suite, used by more than 45,000 customers. Two-year-old SAP Lumira is a data-discovery product created in response to demands for self service and visual data analysis of the kind popularized by the likes of Tableau Software and Qlik. While these tools are easy to use, what they tend to lack is the top-down control and unifying data models enforced by conventional BI systems.
By integrating the two products, SAP says those using Lumira can draw on trusted data held in BusinessObjects Universes (that product's name for IT-approved data models). What's more, dashboards, charts, and other data visualizations created in Lumira can be exported back to BusinessObjects, where administrative layers ensure user- and role-based access control.
"IT can now manage, control, and administer the data while giving business analysts and end users the flexibility to have self-service access to information," Nic Smith, SAP's senior director of analytics product marketing, told InformationWeek.
Another important feature introduced in Lumira 1.19 is an Infographics feature for building data-visualizations combining graphs, charts, and story lines. Infographics are increasingly being used in board rooms, sales presentations, and media appeals. This feature was covered extensively in InformationWeek in BI expert Cindi Howson's comparative review, "Visual Data Discovery: 4 Storytelling Approaches Compared."
In its ninth year, Interop New York (Sept. 29 to Oct. 3) is the premier event for the Northeast IT market. Strongly represented vertical industries include financial services, government, and education. Join more than 5,000 attendees to learn about IT leadership, cloud, collaboration, infrastructure, mobility, risk management and security, and SDN, as well as explore 125 exhibitors' offerings. Register with Discount Code MPIWK to save $200 off Total Access & Conference Passes.
About the Author(s)
You May Also Like
More Insights
Webinars
Editor's Choice


May 2, 2024
While there are plentiful options in cyber resiliency and business continuity tools and platforms, there isn’t one that can knock out everything from sudden cloud outages to prolonged ransomware attacks in a single punch. What can you do to keep the company on its feet no matter what is thrown at it? Find out in this new virtual event.
Reserve Your Seat Now