

Never Miss a Beat: Get a snapshot of the issues affecting the IT industry straight to your inbox.
Why has the crime rate shifted IN Baltimore? A visual analytics video tells the story.
3 Min Read
Back in 2015, I shared some information about Baltimore, regarding its crime statistics specifically, and how crime statistics in general are often mishandled.
In tracking the homicide rate for 2017, I noticed an unusual dynamic. For all of January and half of February, we averaged about one murder a day. While Baltimore's homicide totals have been between 200s and 300s since the 1990s (the rates escalated after the crack market epidemic of the late 1980s/early 1990s), we seldom had over 40 consecutive days with at least one killing.
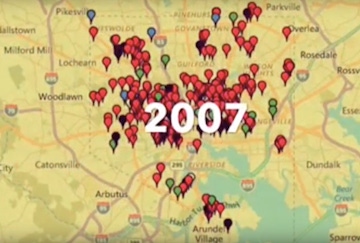
Out of curiosity, I examined the homicide locations from 2001 through 2016 to see if there were any visual clues as to what may have caused this sudden spike; this video shows the patterns:
What jumped out at me, was that by 2016, central Baltimore did not record a single murder and that there were two distinct walls of murder on either side. It also appeared that the areas where the murders occurred were much more compressed than in prior years. Since homicide is a function of proximity and opportunity (i.e., people kill where they live), it makes sense that compressing the footprint of traditionally challenged neighborhoods increases the level of conflict.
The obvious question is, "How did that middle corridor not have a single murder?" Was it because there are now worse marksmen, faster ambulances, or better trauma surgeons in central Baltimore? I think there were three reasons.
First, for the last year, there has been an intentional effort by the city, Johns Hopkins University, and community development groups to designate central Baltimore as a business development and family-friendly corridor. There is a strong push to draw young entrepreneurs and families to this area. Second, and accordingly, the housing policy has changed. The city has legacy policies such as 'Move to Opportunity." This involved the city purchasing homes in the county and offering them as subsidized housing for the poor. But what is new is that young suburbanites are moving back to the city and redeveloping the houses and blocks in that corridor. Third, I believe that this corridor benefits from an augmented policing policy. In addition to coverage from the city police, the Johns Hopkins Campus police, community block watchers and walkers, cameras on the light poles combined for a better surveillance system. In effect, I believe that the multiplicative effect of employment opportunities for skilled young professionals, a revitalized housing policy, and a broader policing policy resulted in the central Baltimore being murder-free in 2016.
As wonderful as this is, there seems to be an unintended consequence. Specifically, the revitalized core means that the traditionally challenged areas could not expand, thus increasing population density. Areas already overwhelmed with crime, food deserts, poor public health conditions, and chronic unemployment, now had to absorb those displaced by the revitalized core strip. Here is the demographic irony that exacerbates the situation -- the young professionals and middle class families have the wherewithal to live in the county or the city. In fact, at certain income levels, to live in the city is a no-brainer because the cost of living is lower. However, the working class and poor cannot afford to move to the county because it is more expensive. Hence they are stuck and cannot trade places with the county folks who moved to the city. The result is a revitalized central Baltimore, but an increased murder rate; a tale of two cities -- the best and worst of times.
But with me being a native Baltimorean, I may be too close to the situation to see what these visuals are really saying. How do you interpret the movements of Baltimore's murders? Is this a valid use of visual analytics?
About the Author(s)
You May Also Like
More Insights
Editor's Choice


May 2, 2024
While there are plentiful options in cyber resiliency and business continuity tools and platforms, there isn’t one that can knock out everything from sudden cloud outages to prolonged ransomware attacks in a single punch. What can you do to keep the company on its feet no matter what is thrown at it? Find out in this new virtual event.
Reserve Your Seat Now