

Never Miss a Beat: Get a snapshot of the issues affecting the IT industry straight to your inbox.
none provided
4 Min Read
Project Elastic.

6 Ways To Lose The Tech 20
6 Ways To Lose The Tech 20 (Click image for larger view and slideshow.)
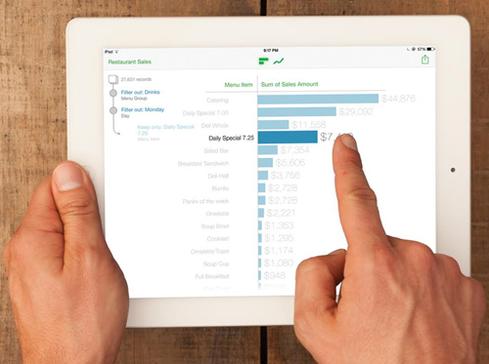
The BI analytics vendor Tableau Software used its annual user conference in Seattle this week to showcase a slew of upcoming development enhancements to its desktop and web visualization interfaces. It also demonstrated for the first time Project Elastic, a standalone app for tablets that lets users interact with downloaded data via swiping and two-finger zooming.
For the fast-growing Tableau, which claims 22,000 accounts worldwide, Elastic is a new kind of software, highlighting the company's 11-year mission to democratize data discovery and data visualization.
The mobile app, which will start early testing with a couple of dozen customers shortly, will be commercially available next year. No decision has been made about Elastic's pricing model, company officials told InformationWeek.
"We're pioneering a new product and marketspace that doesn't exist yet," said Dave Story, vice president of mobile and strategic growth at Tableau. "When you can literally touch your data, the app disappears."
[Can your business make money from Facebook videos? Read Facebook Updates Put Spotlight On Video.]
"We're doing some of our most advanced visualization in Elastic," Story said, and these concepts will be included in future versions of Tableau Desktop. The next version of the desktop tool, likely to be called Tableau 9, is due in the first half of next year, according to other Tableau executives.
Tableau Mobile, an app that was introduced along with Tableau 6.1, will not be going away. Though Tableau Mobile works in conjunction with Tableau Server, Elastic is standalone product and can import large .CSV files directly from an email or a cloud storage site.
Elastic "may overlap but will not obviate Tableau Mobile," said Story, who demonstrated the app working against a 27,000-record file on an iPad. By swiping, a user can filter items from the visualization or change between "average" and "sum"; two-finger zooming focuses the view, down to the individual record. Once a view is created, its image can be shared with others via email from within the app.
Tableau announced a website, tableausoftware.com/be-elastic, where customers can sign up to receive Project Elastic news.
The first public look at Elastic received enthusiastic cheers from the Tableau audience in Seattle during the opening-day keynote.
"Project Elastic, if handled properly, may prove to be another strong point," said conference attendee Benny Tjahjono, director of quantitative analysis at the Federal Home Loan Bank of Chicago. The tool could be a boon to mobile users, predominantly for roadside sales presentations, he said. "It may prove itself to be a product that no organization can live without."
But not all users said they'd rush out and buy it.
"Probably not," said Kevin King, director of reporting and analytics at Coca-Cola Bottling Co. Consolidated. He'd prefer to keep giving sales and delivery personnel static dashboards.
Currently, the soft drink bottler sends its mobile personnel a Tableau view embedded into SharePoint. The Tableau dashboard, featuring 20 sales and operational metrics, is assembled automatically every night and sent to 800 iPads.
Another Tableau customer, Allrecipes, said Elastic might have a role.
"For live transaction things, this app would be great," said Grace Preyapongpisa, vice president of business intelligence at the recipe site. She said the tool could give traveling executives an interactive view of traffic, such as around Thanksgiving, when the social media site for cooks sometimes sees a tripling of its Internet traffic.
When asked if she worried that a business user on Elastic might misinterpret data and make incorrect decisions, Preyapongpisa said her team would preaggregate the view before sending anything out. "The risk is higher with [executives misinterpreting] Omniture or Excel."
Indeed, Tableau's Story argued the worry about business users misinterpreting data if given self-discovery tools such as Elastic or a conventional Tableau interactive dashboard is a red herring -- a throwback to an earlier, "command and control" age of data management.
Tableau's "fundamental insight" is that business users, not BI analysts or IT departments, understand business data best, he said. "The validation of [the data model] always comes from a business person."
Do you need a deeper leadership bench? Send your most promising leaders to our InformationWeek Leadership Summit, Sept. 30 in New York City, for a day of peer learning and strategic speakers.
About the Author(s)
You May Also Like
More Insights
Webinars
Editor's Choice


May 2, 2024
While there are plentiful options in cyber resiliency and business continuity tools and platforms, there isn’t one that can knock out everything from sudden cloud outages to prolonged ransomware attacks in a single punch. What can you do to keep the company on its feet no matter what is thrown at it? Find out in this new virtual event.
Reserve Your Seat Now